February 2026 P&L Review
Stronger Momentum, Expanded Capital, Elevated Execution
February 2026 marked another milestone month for TradeX Protocol.
Following January’s exceptional +10.29% performance, February delivered an even stronger +10.72% standalone net ROI, reinforcing the consistency of our execution framework across varying market conditions.
This marks the second consecutive month of double-digit performance, achieved through structured deployment, disciplined capital management, and expanded opportunity capture across multiple asset classes.
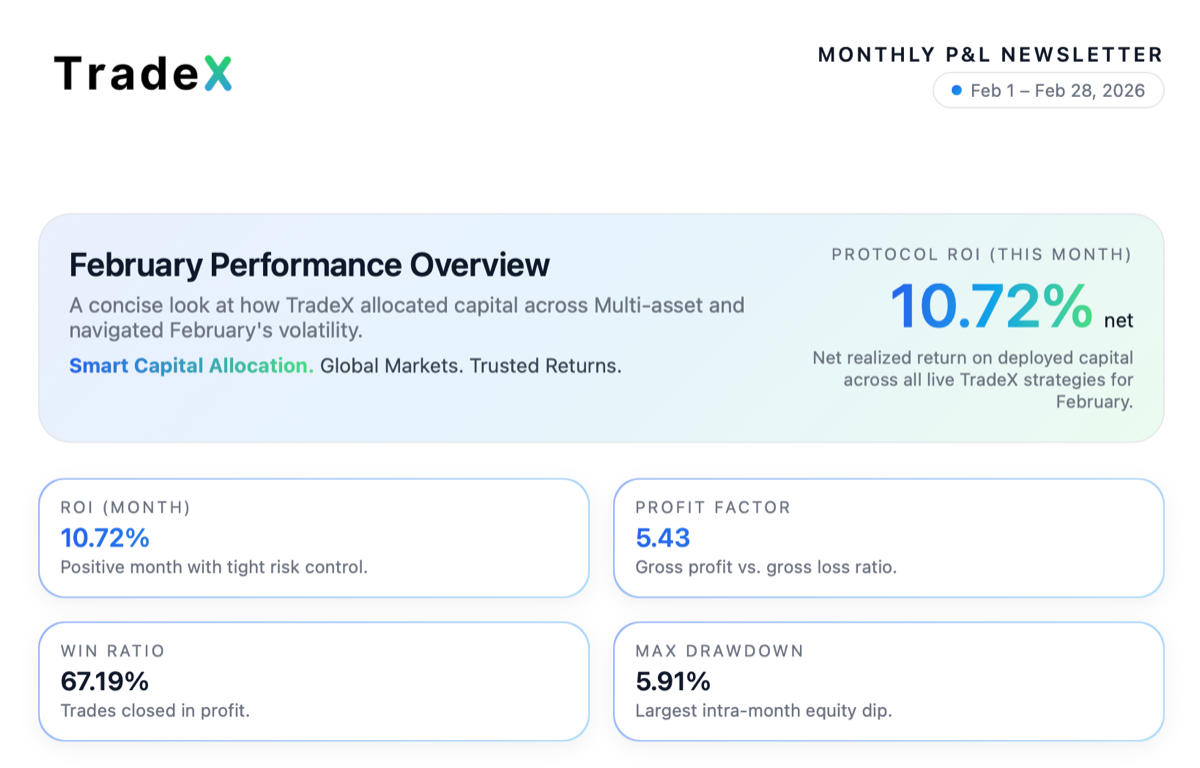
TradeX February newsletter shows 10.72% ROI, 67.19% win ratio, strong allocation discipline, profit factor 5.43, and controlled drawdown.
Performance Snapshot
| February 2026 Metrics | Value |
|---|---|
| Net ROI | +10.72% |
| Profit Factor | 5.43 |
| Win Ratio | 67.19% |
| Maximum Drawdown | 5.91% |
| Active Trading Days | 15 out of 20 available sessions |
| Assets Under Management | $1.8354M |
| Net Performance (Since Inception) | $275,969 |
February provided 20 potential trading days. We actively deployed capital on 15 of them, a strong participation rate while still maintaining selectivity and execution discipline.
Importantly, the increase in performance versus January was not driven by excessive leverage or uncontrolled exposure. The improvement reflects better volatility alignment and broader opportunity windows.
February Market Conditions
The month was characterized by elevated cross-asset volatility and macro-driven price reactions.
Gold
Gold experienced sharp directional moves driven by:
- Interest rate expectations
- Inflation-related data releases
- Macro positioning shifts
These conditions created structured breakout and reversal opportunities.
USDJPY
USDJPY showed meaningful directional swings due to policy divergence and shifting yield expectations, allowing for tactical entries within defined risk zones.
US100
The US100 index rotated through sector-specific volatility, creating shorter-duration but profitable momentum windows.
Crypto (XRP & BTC)
XRP and BTC saw liquidity expansions and volatility spikes, particularly during risk-on phases, which aligned well with our systematic and hybrid execution models.
Overall, February favored structured volatility capture strategies over passive trend-following.
Strategy Contributions
Alpha X6 Strategy – Hybrid Execution Model
The primary performance driver in February was the Alpha X6 strategy.
- Capital Allocation: $400,000
- Monthly Return: +15.66%
- Primary Markets: XRP and Gold
- Execution Model: Hybrid (Manual + Systematic + Automated-Assisted)
Alpha X6 combines systematic signal-based entry models, manual macro context validation, and automated-assisted execution.
This hybrid structure allowed the strategy to rotate capital quickly during high-momentum windows, particularly in Gold and XRP.
The performance of Alpha X6 significantly contributed to overall portfolio growth and elevated February’s blended return.
Core Strategy Performance
Excluding Alpha X6, the remaining strategies delivered an average of approximately 7.5% for the month.
These strategies operated across:
- Gold
- US100
- BTC
- USDJPY
This demonstrates that performance was diversified and not dependent on a single market or strategy type. While Alpha X6 outperformed, the broader portfolio maintained stable and controlled profitability.
Risk Metrics & Execution Discipline
February’s performance must be evaluated in the context of its risk metrics.
- Profit Factor: 5.43 — strong reward relative to risk per trade.
- Win Ratio: 67.19% — high execution accuracy across deployed capital.
- Maximum Drawdown: 5.91% — within acceptable operational parameters during active deployment phases.
While February saw higher deployment frequency compared to January, drawdown remained controlled and recovery cycles were efficient.
The focus remains on capital preservation first and performance second.
Capital Growth & AUM Expansion
As of end-February:
- Assets Under Management: $1.8354M
- Net Performance to Date: $275,969
February also saw a meaningful capital addition, strengthening the overall deployment base.
An expanded capital pool allows for:
- Better allocation efficiency
- Increased diversification
- Improved liquidity management
- More strategic scaling opportunities
Capital depth improves stability and flexibility in execution.
February vs January Comparison
| Metric | January 2026 | February 2026 |
|---|---|---|
| Net ROI | +10.29% | +10.72% |
| Trading Days | Higher deployment month | 15 of 20 sessions |
| Market Driver | Gold-focused structure | Multi-asset volatility |
| Strategy Impact | Strong systematic focus | Hybrid + systematic blend |
While January was already exceptional, February demonstrated improved capital rotation and stronger volatility alignment, producing marginally higher returns without compromising risk discipline.
Strategic Takeaways
- Hybrid execution models proved highly effective during volatility expansions.
- Multi-asset exposure reduced directional dependency.
- Capital scaling improved deployment efficiency.
- Structured volatility capture remains core to performance generation.
Outlook
Looking ahead, we expect:
- Continued macro sensitivity in Gold
- Policy-driven movement in USDJPY
- Crypto momentum cycles in XRP and BTC
- Rotational volatility in equity indices
Our deployment philosophy remains unchanged:
- Capital preservation first
- Controlled drawdown thresholds
- Structured exposure
- Selective participation
- Systematic recovery models
Consistency remains the objective, not overextension.
Follow TradeX Protocol for weekly insights and transparent performance reviews.
TradeX — Where timeless financial wisdom meets intelligent investing.
Smart Capital Allocation | Global Markets | Trusted Returns
Recent Posts