January 2026 P&L Review
Macro Exhaustion. Strategic Short Exposure. Controlled Volatility.
January 2026 will likely be remembered as one of the most violent cross-asset liquidation phases in recent years.
An estimated $3 trillion was erased across Gold, Silver, and Crypto markets within a compressed time window. Precious metals broke sharply from euphoric highs, and digital assets followed through in synchronized deleveraging.
TradeX entered this environment prepared, not reactive.
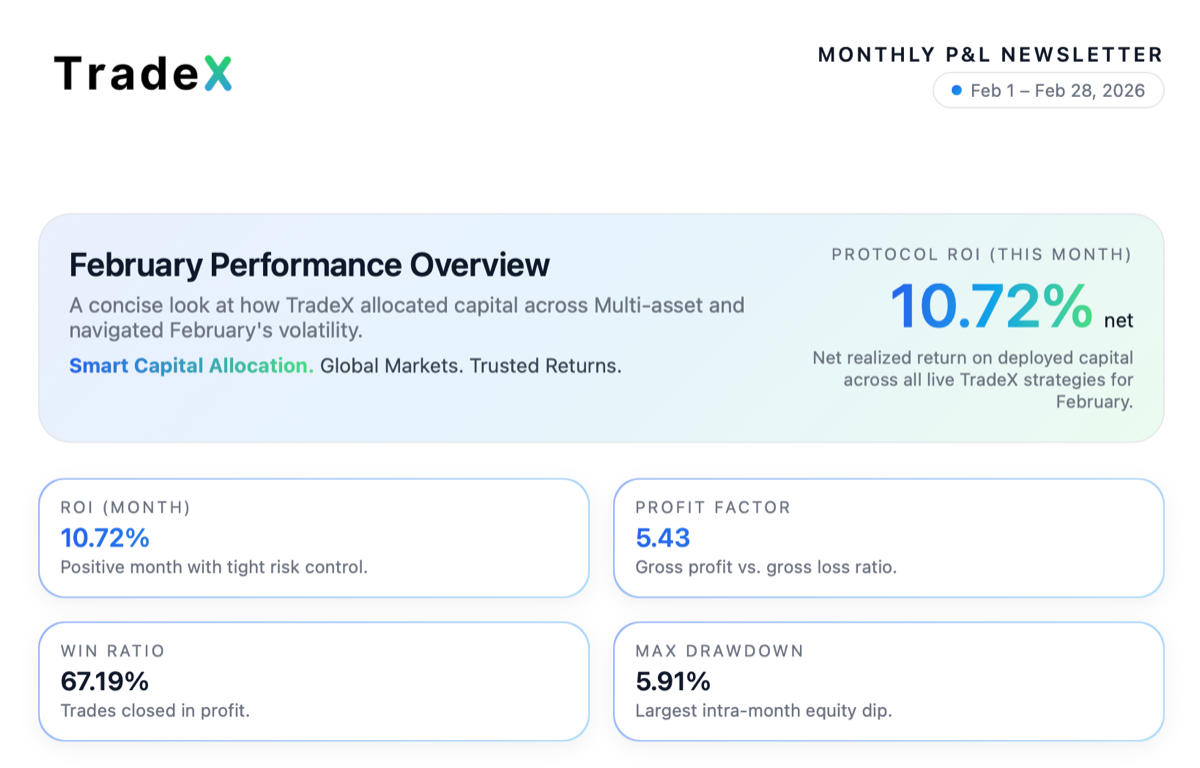
January Performance Overview: 10.29% ROI with strategic short positions and structured exposure, supported by strong profit factor, win ratio, and controlled drawdown.
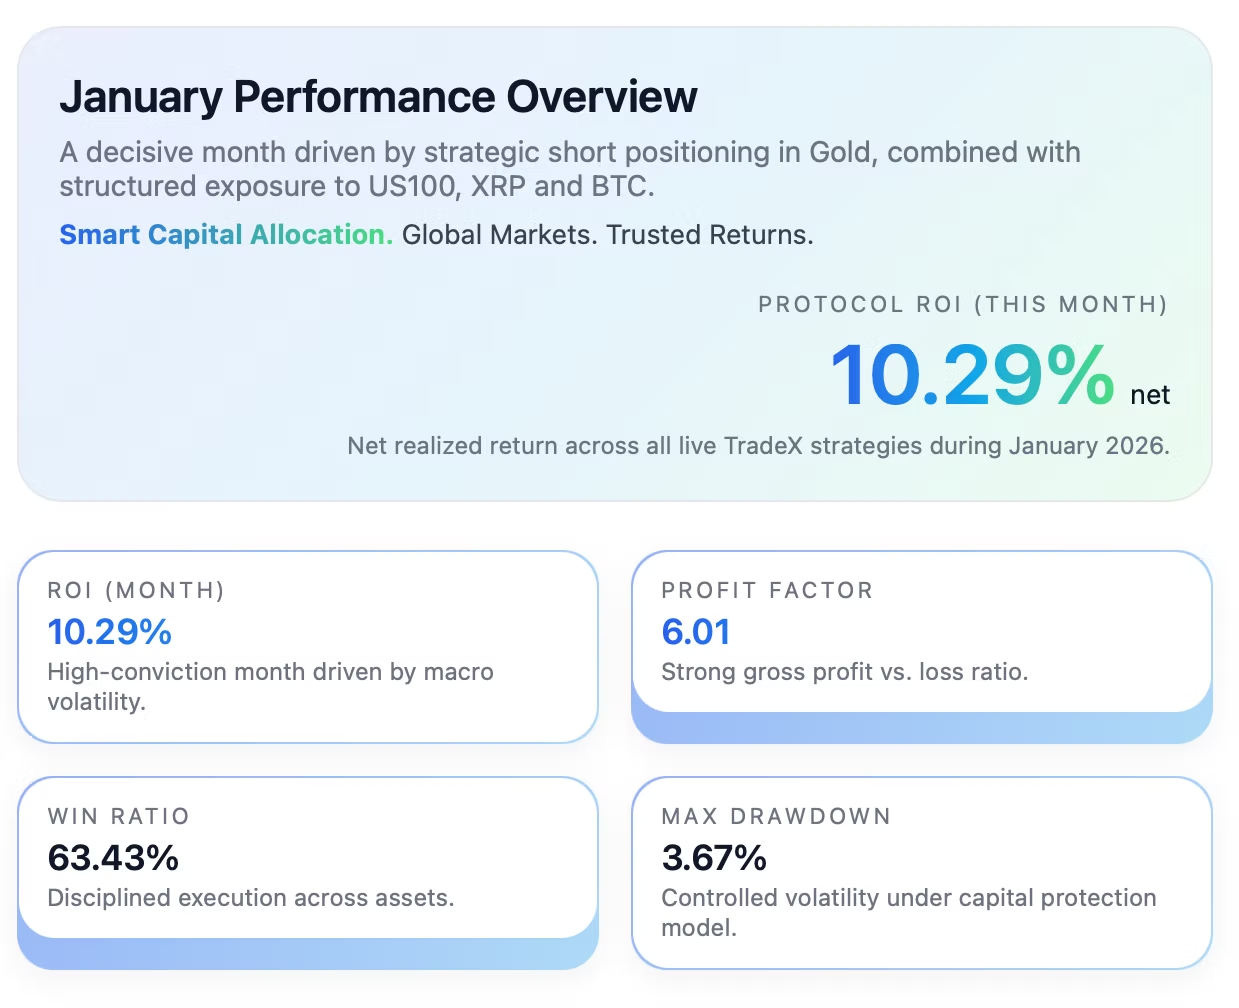
January Performance Overview
| January 2026 Metrics | Value |
|---|---|
| Net ROI | 10.29% |
| Profit Factor | 6.01 |
| Win Ratio | 63.43% |
| Maximum Drawdown | 3.67% |
This return was driven primarily by structured short exposure in Gold at macro resistance levels, supported by tactical allocation in US100, XRP, and BTC.
More importantly, it was achieved while maintaining disciplined risk controls and controlled volatility throughout a chaotic market phase.
This report breaks down how and why.
1. Macro Environment Entering January
Gold began January in a vertical ascent.
Momentum accelerated beyond the 5,500+ all-time high zone, driven by:
- Inflation hedging narratives
- Geopolitical risk positioning
- Retail FOMO flows
- Late-cycle momentum buying
However, internally, several signals were flashing divergence:
- Liquidity thinning at higher levels
- Overextension relative to macro trend structure
- Volatility compression preceding expansion
- Sentiment asymmetry favoring late longs
Our models flagged exhaustion conditions, not continuation.
Instead of chasing price, exposure was structured toward short bias at elevated levels.
This is where algorithmic discipline matters.
2. The Gold Short Thesis
The short thesis was built on three layers:
A. Structural Resistance
Price entered historically extended zones where upside required sustained new capital inflow, which was not materializing at scale.
B. Volatility Imbalance
Compressed volatility at highs typically precedes expansion events. Expansion from overbought levels often resolves downward.
C. Liquidity Trap Risk
Late entrants positioned aggressively long. If liquidity reversed, liquidation cascades were probable.
When the first rejection occurred, exposure was scaled incrementally, not all at once.
This phased approach allowed:
- Controlled initial risk
- Scalable conviction as the thesis validated
- Avoidance of emotional overcommitment
The correction that followed validated positioning.
3. The $3 Trillion Liquidation Event
Mid-to-late January saw aggressive deleveraging across asset classes:
- Gold retraced sharply from highs
- Silver accelerated downside volatility
- Crypto markets mirrored liquidity unwind
- Risk assets experienced synchronized stress
Estimated capital erased: ~$3 trillion.
What makes this event significant is not just magnitude, but speed.
Many discretionary traders were caught long into euphoria. TradeX was positioned opposite that flow.
The Gold short became the dominant performance contributor for the month.
4. Capital Allocation Strategy – January
Capital was deployed with conviction weighting, not concentration risk.
| Allocation Breakdown | Weight |
|---|---|
| Gold | 45% |
| US100 | 20% |
| XRP | 15% |
| BTC | 20% |
Gold carried the highest allocation because it offered the strongest macro asymmetry.
US100 provided structured index exposure during liquidity shifts.
XRP and BTC exposure allowed participation in crypto volatility without full portfolio dependency on digital assets.
This structure ensured diversification across metals, indices, and crypto.
Balanced exposure reduced correlation risk while preserving opportunity capture.
5. Risk & Drawdown Control
Volatility expansion periods test strategy robustness.
Despite aggressive market movement, maximum drawdown remained limited to:
3.67%
This was achieved through:
- Dynamic position scaling
- Risk compression during volatility spikes
- Automated recovery adjustments
- Strict exposure caps per asset
The goal is not zero drawdown.
The goal is controlled drawdown with asymmetric upside capture.
January validated this framework.
6. Performance Metrics Breakdown
Net ROI: 10.29%
This was not a single trade spike. Performance was distributed across structured execution days, with acceleration during liquidation windows.
Profit Factor: 6.01
Gross profit significantly outweighed gross loss.
This indicates:
- High-quality trade filtering
- Strong reward-to-risk alignment
- Minimal loss clustering
Win Ratio: 63.43%
Not excessively high, which is healthy.
Extremely high win ratios often indicate tight profit caps. Our model allows controlled losses to preserve asymmetric upside.
7. Why January Was Strategically Important
January demonstrated three core characteristics of the TradeX system:
- Patience Over Momentum — we did not chase vertical Gold expansion.
- Conviction When Probability Aligns — short exposure was scaled when macro exhaustion confirmed.
- Protection During Chaos — despite a multi-trillion-dollar liquidation event, downside remained tightly managed.
This combination defines sustainable performance.
8. February 2026 Outlook
Post-liquidation environments typically transition into one of two paths:
- Secondary volatility wave
- Structural consolidation phase
We are currently monitoring:
- Gold reaction to breakdown levels — continuation vs base formation
- Crypto volatility persistence after deleveraging
- US100 liquidity rotation following macro repricing
- Potential secondary bounce attempts in metals
The February approach remains disciplined:
- Selective exposure
- Volatility-aware positioning
- Capital protection first
We do not assume trend continuation blindly. We reassess structure continuously.
9. Strategic Summary
January 2026 was a volatility-defined month.
While markets erased trillions in capital, TradeX captured structured downside in metals while preserving capital stability.
- January Net ROI: 10.29%
- Max Drawdown: 3.67%
- Profit Factor: 6.01
The objective remains unchanged:
Sustainable, algorithm-driven, macro-aware trading with controlled risk and transparent performance.
February positioning is active. Risk remains managed. Execution remains systematic.
Follow TradeX Protocol for weekly insights and transparent performance reviews.
TradeX — Where timeless financial wisdom meets intelligent investing.
Smart Capital Allocation | Global Markets | Trusted Returns
Recent Posts